In a previous post, I highlighted the “peanut-butter spread” issue that often manifests even in seemingly mature project-selection processes, and cited a real-world example showing how high-impact IT project candidates are often missed completely. In that post, it was obvious to the IT PMO Director that his organization’s performance was constrained by persistent bottlenecks and delays in its procurement function, and that any improvement there would yield large and immediate benefits throughout the organization. In that case, the key was first to find ways to expose hidden capacity at the system constraint (procurement), and then to find ways to expand that capacity. Exposing hidden capacity can often be done without any additional IT investment at all, while expanding capacity typically calls for new IT investments. Both, however, require the allocation of scarce resources for some period of time in order to deliver the desired result—in this case, the most constrained resource was the senior procurement expert. So even if this organization had an abundance of great project candidates focused on improving procurement processes, its ability to execute them would be constrained by the availability of the senior procurement expert.
Let’s see how this factors into our project-selection process. Imagine that we have three software-development projects that we’re trying to choose between, and that once the projects are complete and the software is put into operation, we’ve estimated the following expected revenues and costs:

At first glance, it seems clear that Project Z is the best option of the three—it has both the highest revenue expectation, and the lowest expected cost. However, we have yet to factor in the availability of our senior procurement expert (system constraint)—what if we only have 30 days’ worth of work hours per month at our constraint to devote to whatever mix of projects is selected? In that case, Project Z uses up all available “constraint units,” and delivers a monthly profit per constraint unit of $60,000.
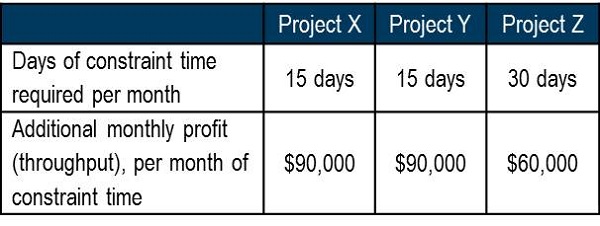
Projects X and Y are both lower profit per month ($45K each), but each requires only half of the available constraint units, affording us the option to choose both of them in lieu of Project Z. The result is a monthly profit of $90,000, or 50 percent higher than Project Z. Even if we were to double our available constraint units, we will want to fund as many project candidates like X and Y as we can, before it makes sense for us even to consider Z.
For organizations that do not measure their mission success in profit dollars, we can substitute whatever metric makes the most sense, and the approach works the same. So, whether we want to measure the throughput of profit dollars, or the throughput of veterans receiving quality medical care, we can just use the term ‘throughput’ to cover all bases.[1]
This gives us a simple formula to start with:
Throughput per Constraint Unit (T/CU).
One way to think of T/CU is in terms of “effective throughput,” as it represents what we actually expect to achieve, given what we know about how our system constraint limits throughput.[2] I simply need to get defensible estimates of T/CU for each project candidate, and fund the highest-scoring ones for which I have budget and available CUs to support.
Factoring in Investment
For simplicity, the above example assumes that all project investment funds are fully amortized into total variable cost. While this is becoming more of an option through software-as-a-service (SaaS) offerings, most IT project portfolios require a substantial pool of investment funds. As a result, we must incorporate investment into our project-selection model.
Let’s keep expected revenue and days of constraint time the same for all three projects, but move the portion of total variable cost that was amortized investment down to the “total investment” line, in a single lump sum. Let’s also show Projects X and Y as requiring significantly higher investment levels than Project Z. Keeping the expected life span for all three IT systems the same (five years), we then calculate the new monthly profit (throughput) figures that result, as well as the ROI and “T/CU per $1,000 invested” metrics.
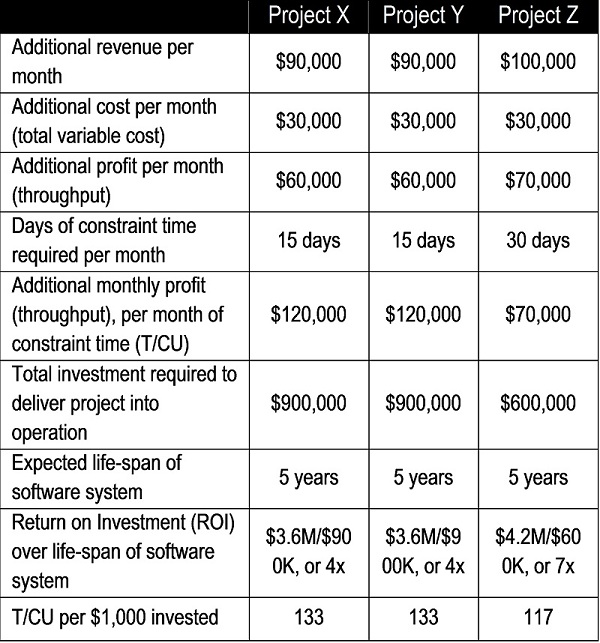
As before, Project Z looks like the best project when considering its profitability, the smaller investment level required to fund the project, and the resulting high ROI. However, when considering Effective Throughput (T/CU) per dollar amount invested, Projects X and Y still score higher. We now have a very useful project-selection metric that we’ll call “Effective ROI,” as it calculates the actual ROI expected when taking into account the system constraint:[3]
Throughput per Constraint Unit,
per Investment (T/CU/I)
To be even more accurate, we would need to refine the metric further by factoring in how long those investment dollars are tied up in project work, and incorporating the time value of money for the entire model. However, try to resist the temptation to over-engineer these calculations, as you will very quickly see the “law of diminishing returns” come into play.
In our book, we address a few additional considerations that often prove critical, such as how to incorporate the strategic value of project candidates into Effective ROI; the importance of distinguishing between projects that exploit hidden capacity vs. those that expand capacity (and how to sequence them accordingly); and how to handle situations in which IT is itself the system constraint. For most of you, however, the concepts presented in this blog post should be enough to get you started. Please let us know of your experiences applying Effective ROI—we’d love to hear from you!
[1] Not to be confused with “project throughput,” which we use in this blog (and in our book) to indicate the rate at which projects are completed.
[2] Effective throughput is sometimes referred to as “octane level” in TOC literature.
[3] Note that T/CU/I is mathematically equivalent to T/I/CU. For those readers familiar with the notion of “investment turns,” T/I is the throughput accounting formula for investment turns, so T/I/CU can also be thought of as “investment turns per constraint unit.”
You must log in to post a comment. Log in now.